

This week I had the opportunity to discuss sustainability from a geospatial perspective with Nathan Eaton, Executive Director at NGIS in Australia. This session was recorded for the May 19, 2021 Spatial Data Science in CPG & Retail Summit hosted by CARTO, as part of their 2021 Spatial Data Science Conference.
This Spatial Data Science Conference is a gathering of data science, advanced analytics, and GIS experts from across the globe. The geospatial community has experienced significant growth as businesses and organizations utilize location-based analytics to adapt to the new era we are living in.
I would expect this trend to continue as earth observation and machine learning tools become more powerful. According to a March 2021 research report, the global geospatial analytics market size was valued at $58.35 billion in 2019, and is projected to reach $158.84 billion by 2027, growing at a CAGR of 14.2% from 2020 to 2027. For comparison, in 2020, AWS had $45.37 billion in revenue. So the geospatial market is big.
Geospatial analytics are crucial for sustainability, because looking at the surface of the Earth can tell us a lot about the effects of climate change, especially using satellite imagery. For example, here is a Google Earth Timelapse of the Columbia Glacier retreat in Alaska:

Here are some of the specific technologies and products that Nathan and I talked about during our talk:
- BigQuery CARTO Spatial Extension
- CARTO for React using the open source project deck.gl
- Google Cloud product discovery solutions for retail including Search for Retail
- Google Earth Engine, used to monitor global deforestation by Global Forest Watch
- Google Cloud Vertex AI
Doing this talk gave me an opportunity to reflect on the technology aspects of geospatial analytics as well. Things have progressed quite a lot since 2014, when I last worked extensively in the space. At that time, I was CTO of an early-stage startup that focused on retail store location analysis for investors. This phrase didn’t exist at the time, but today you would have called us an “alternative data” provider. Here’s how we described this functionality in our sales deck:
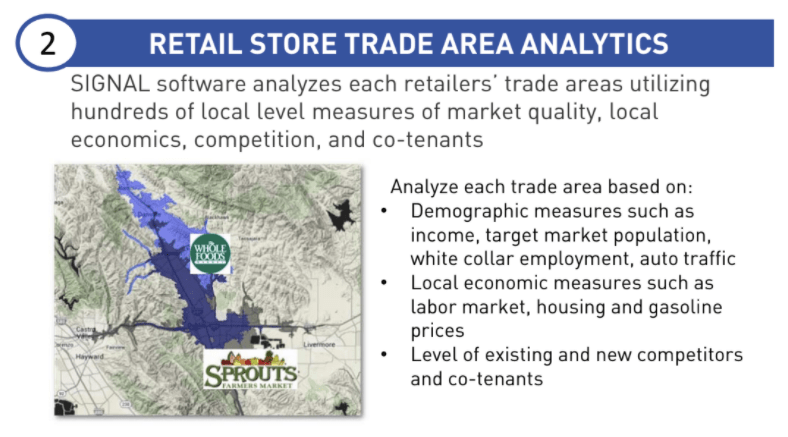
To build these store location analytics, we collected (scraped) retail store locations from retailer websites and geocoded the street addresses to capture latitude and longitude for each store. Then we calculated “trade areas”, or shapes around each store representing the area where customers were mostly likely traveling from to shop. We used a few different methods to do this, including “simple rings” (5-mile radius, etc.) and “travel time” (e.g. 10-minute driving time, also called isochrones). Ultimately each trade area become a geometric Polygon, an array of points, that we stored in the database.
After creating the trade area polygons, we computed demographics like total population and median household income for space within each trade area using US Census data. Finally, we aggregated these stats for each retail chain and provided tools to compare different retail chains, and understand how these metrics changed over time with new store openings and store closings.
Our primary toolset at the time included ESRI, MongoDB, PostGIS, and Python. If I had to do this now, I would definitely start with BigQuery and more data science friendly tools like CARTO. It would be much simpler!
At any rate, please enjoy the talk, and feel free to contact me on Twitter or LinkedIn if you’re interested in any of this geospatial sustainability stuff.
